The latest air cargo market report from WorldACD:

Nearing the end of 2020, the world looks back at a year like no other in most people’s memories. Air cargo was no exception: the usual trends, established over many years, were no guidance at all for what actually happened. Volatility, both in volumes and in rates, has been the order of the day in many markets in 2020.
November saw a worldwide volume drop of 12.6% year-on-year (YoY), a decrease percentage which has more or less become the norm in the second half of 2020. This was coupled with the strongest YoY rate/yield increase (in USD) since the crazy months of April and May: + 79% YoY, an increase substantially higher than in the previous months.
Yields/rates in November are usually about 4% above those in October; this year the increase was 11.2%, from USD 2.97 to USD 3.30 (volume was down by 2% MoM). We already reported on this trend in our recent weekly updates.
Asia Pacific was the only origin region growing its air cargo business between October and November (by 3.2%). Remarkably, yields/rates from Africa and MESA (Middle East & South Asia) dropped MoM. Not surprisingly, given the large orders of ‘PPE-goods’, shipments above 5000 kgs grew YoY, whilst all smaller weight breaks lost between 16% and 29% YoY. The grimmest November statistic was this one: the transport by air of human remains grew by 8% YoY…
Overall capacity went up by 1% from October to November: freighter capacity decreased by 1% MoM, whilst cargo capacity on passenger aircraft went up by 3%. Load factors on passenger aircraft increased by 1%-point, and on freighter aircraft decreased (slight drop of 1%).
Calling the air cargo market hot, would probably be the understatement of the year. The usual trends from the pre-COVID days seem to have become just faint memories. Have a look at the November yields/rates for some of the largest markets in the world:
- Highest average: Hong Kong to USA Midwest: USD 6.88/kg
- Highest percentual YoY increase: United Kingdom to USA North East: +289%
- Highest absolute change YoY: China East to USA Midwest: +USD 3.43
- Highest percentual change vs October 2020: South Korea to Germany: +58%.
With all the changes this year, one thing that hardly changed was the traffic pattern of airlines. As a percentage of their total business, traffic originating in, or destined for, their respective home bases, just went from 40% to 39% since November 2019.
Airlines based in Asia Pacific continued to score highest on “home-grown/home-bound” volumes (changing from 56% to 58%), while airlines based in MESA further improved their position as the “champions of third-country traffic” (from 28% to 25%).
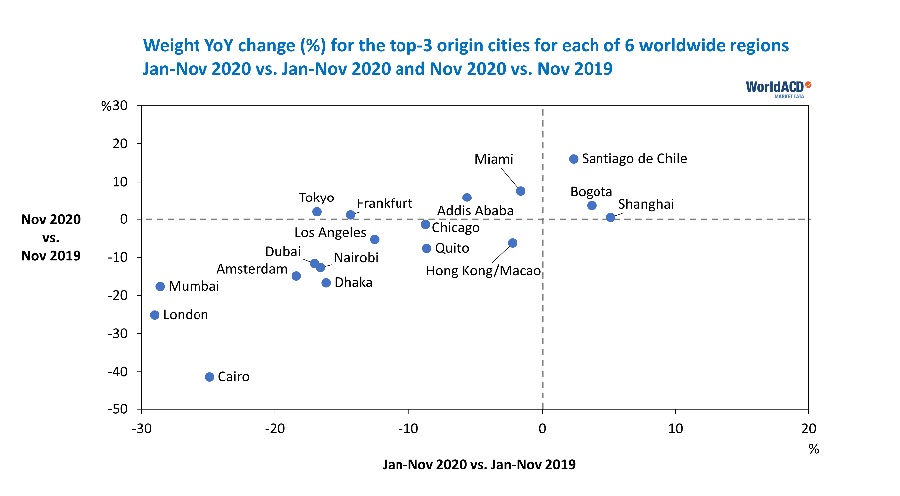
The fate of each region’s top-3 origins in 2020 could hardly have been more varied. Of the 18 cities we reviewed, three increased their business in spite of the severe worldwide drop: Shanghai, Bogota and Santiago de Chile. The other 15 lost business, but in very different measures.
For cities like Cairo, London and Mumbai, it must have come as a shock to their systems to see that business originating with them decreased by so much more than the worldwide average of 16% (Jan-Nov 2020).
But in this uncommon year, volume changes are almost the minor part of the story. Take the case of Chicago: outbound business dropped by 9% (Jan-Nov YoY), but generated 10% more revenues for the airlines. At the same time, airline revenues from inbound traffic to Chicago increased by an incredible 92% YoY. Can things get any stranger?
Last, but not least, the preliminary figures for the first half of December. Worldwide volume was 2% higher compared with the first half of November, showing a better MoM trend than the trend from October to November. Origin regions with the highest volume increase were Africa (+21%) and Central & South America (+8%).
Load factors show a consistent, though small, increase since the beginning of November. Worldwide average yields/rates (per kg) reached a level of USD 3.32 in the second week of December, two cents above the November-average.

