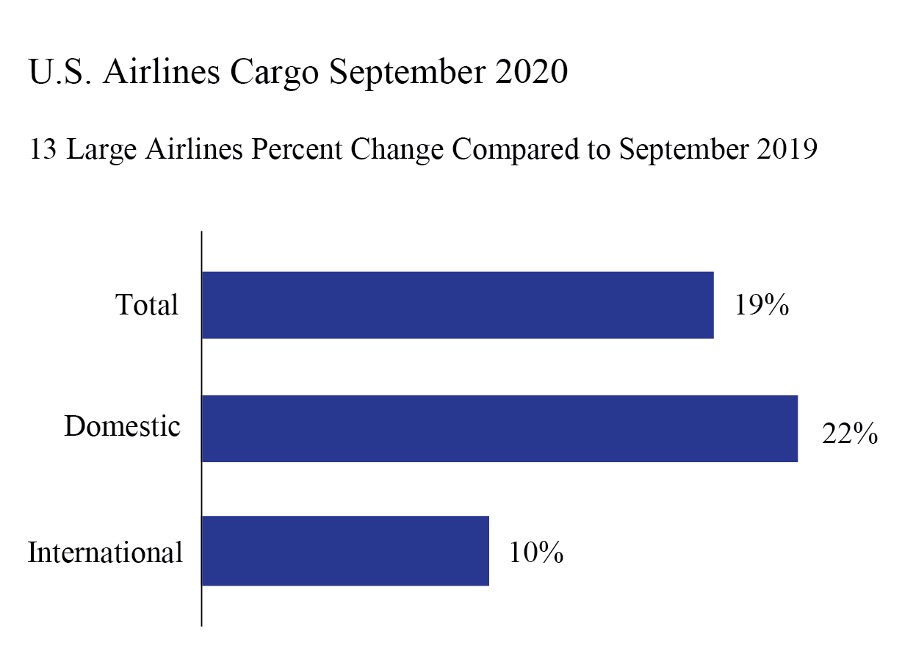
US airlines carried 19% more cargo by weight in September 2020 (preliminary) than in September 2019. The rise was fueled by a gain of 22% in domestic cargo and a 10% rise in international cargo, according to data filed with the Bureau of Transportation Statistics (BTS) by 15 of the leading US cargo airlines.
The 15 airlines carry 95% of the total cargo by weight on US airlines. Cargo data consists of freight and mail carried within the US and between the US and foreign points.
September 2020 (preliminary) air cargo numbers for 15 US carriers:
- Total: 1,625 thousand tons, up 18.6% from September 2019 (1,370T tons)
- Domestic: 1,212T tons, up 21.7% from September 2019 (996T tons)
- International: 413T tons, up 10.5% from September 2019 (374T tons)
US airline traffic reports are filed monthly with BTS. Final September data will be released on Dec. 10. Complete international data by origin and destination, which is under a six-month confidentiality restriction, will be released on March 11.
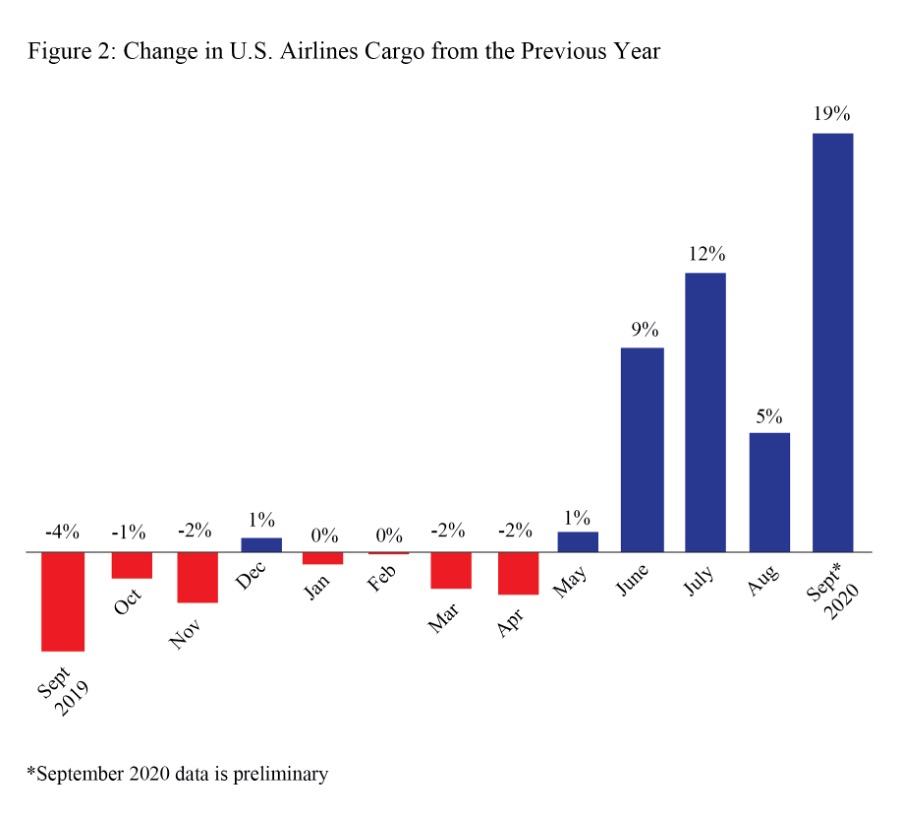
Systemwide Cargo (Domestic + International)
September 2020 cargo: 1,625T tons
Change from September 2019: +18.6%
Change from August 2020: -0.3%
Recent high: July 2020 (1,699T tons)
Recent low: February 2020 (1,297T tons)
Table 1: Systemwide Percent Change in US Airlines Cargo by Weight from the Same Month of the Previous Year 2016-2020
Cargo = Freight + Mail
| Year-to-Year Percent Change | ||||
| 2016-2017 | 2017-2018 | 2018-2019 | 2019-2020 | |
| January | 6.4 | 10.5 | 5.1 | -0.5 |
| February | 6.1 | 9.2 | -0.3 | -0.1 |
| March | 8.0 | 5.8 | -0.2 | -1.6 |
| April | 2.6 | 5.9 | 4.4 | -1.9 |
| May | 10.8 | 9.0 | 3.1 | 0.9 |
| June | 6.8 | 5.5 | -1.1 | 9.1 |
| July | 6.9 | 6.7 | 3.5 | 12.8 |
| August | 9.7 | 5.0 | 0.2 | 5.3 |
| September | 4.3 | 5.0 | -4.4 | 18.6* |
| October | 10.6 | 5.5 | -1.2 | |
| November | 10.6 | -0.6 | -2.3 | |
| December | 5.6 | 0.3 | 0.7 | |
| Jan-Sept | 6.8 | 6.9 | 1.1 | 4.7 |
| Annual | 7.4 | 5.4 | 0.6 |
Source: Bureau of Transportation Statistics, T-100 Market
* September 2020 data is preliminary
Domestic Cargo
September 2020 cargo: 1,212T tons
Change from September 2019: +21.7%
Change from August 2020: -0.4%
Recent high: July 2020 (1,282T tons)
Recent low: February 2020 (977T tons)
Domestic as percent of total cargo September 2019: 72.7%
Domestic as percent of total cargo September 2020: 74.6%
Table 2: Domestic Percent Change in US Airlines Cargo by Weight from the Same Month of the Previous Year 2016-2020
Domestic cargo has a US origin and US destination
Cargo = Freight + Mail
| Year-to-Year Percent Change | ||||
| 2016-2017 | 2017-2018 | 2018-2019 | 2019-2020 | |
| January | 4.6 | 10.4 | 6.1 | 2.8 |
| February | 4.9 | 8.7 | 0.7 | 2.2 |
| March | 7.1 | 4.0 | -0.4 | 3.1 |
| April | 1.5 | 4.9 | 7.7 | 3.1 |
| May | 10.8 | 8.9 | 4.5 | 4.2 |
| June | 5.4 | 4.5 | 0.5 | 12.7 |
| July | 5.2 | 6.7 | 6.2 | 15.8 |
| August | 9.4 | 4.8 | 0.1 | 6.6 |
| September | 3.3 | 4.3 | -2.9 | 21.7* |
| October | 11.1 | 5.7 | 1.8 | |
| November | 11.3 | -0.1 | -1.8 | |
| December | 5.1 | 0.1 | 4.5 | |
| Jan-Sept | 5.8 | 6.3 | 2.5 | 7.9 |
| Annual | 6.7 | 5.0 | 2.2 |
Source: Bureau of Transportation Statistics, T-100 Domestic Market
* September 2020 data is preliminary
International Cargo
September 2020 cargo: 413T tons
Change from September 2019: +10.5%
Change from August 2020: -0.1%
Recent high: July 2020 (417T tons)
Recent low: February 2020 (319T tons)
International as percent of total cargo September 2019: 27.3%
International as percent of total cargo September 2020: 25.4%
Table 3: International Percent Change in US Airlines Cargo by Weight from the Same Month of the Previous Year 2016-2020
International cargo on a US airline is carried between a US airport and a foreign airport.
Cargo = Freight + Mail
| Year-to-Year Percent Change | ||||
| 2016-2017 | 2017-2018 | 2018-2019 | 2019-2020 | |
| January | 11.4 | 10.6 | 2.2 | -9.8 |
| February | 9.6 | 10.4 | -3.1 | -6.3 |
| March | 10.5 | 10.7 | 0.4 | -13.9 |
| April | 5.3 | 8.2 | -3.9 | -15.7 |
| May | 11.0 | 9.2 | -0.6 | -8.3 |
| June | 10.8 | 8.2 | -5.2 | -0.6 |
| July | 11.3 | 6.7 | -3.6 | 4.5 |
| August | 10.6 | 5.6 | 0.4 | 1.7 |
| September | 7.2 | 7.0 | -8.3 | 10.5* |
| October | 9.4 | 5.0 | -8.7 | |
| November | 8.8 | -1.8 | -3.5 | |
| December | 7.2 | 0.9 | -10.6 | |
| Jan-Sept | 9.7 | 8.4 | -2.4 | -4.3 |
| Annual | 9.4 | 6.5 | -3.8 |
Source: Bureau of Transportation Statistics, T-100 International Market
* September 2020 data is preliminary
Reporting Notes
Data are compiled from monthly reports filed with BTS by commercial US air carriers detailing operations, passenger traffic and freight traffic. This release includes data received by BTS from 15 US airlines as of Nov. 5.

