Airports Council International (ACI) World has today published its preliminary world airport traffic rankings – covering passenger traffic, cargo volumes, and aircraft movements for 2020 – showing the dramatic impact of COVID-19 on what are ordinarily the world’s busiest airports.
Global passenger traffic at the world’s top 10 busiest airports decreased by -45.7% in 2020. Overall, passenger traffic at the world’s airports decreased by -64.6% which shows that the impact of the pandemic and the early stages of recovery in air travel has not been uniform around the world.
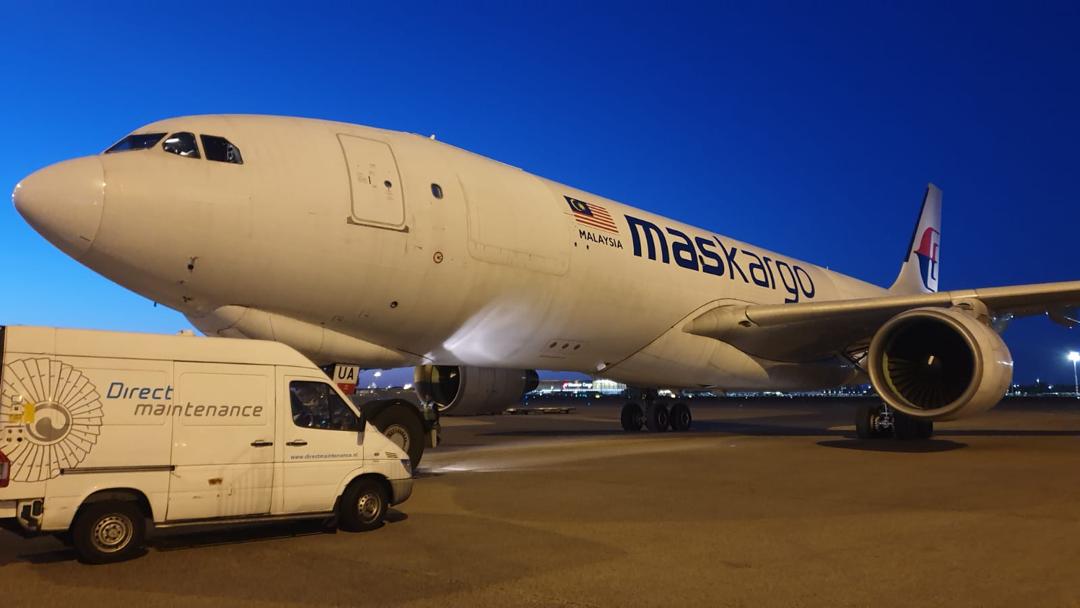
Air cargo was less impacted by COVID 19, with volumes decreasing by only -8.9%, to an estimated 109 million metric tonnes in 2020, equivalent to 2016 levels (110 million metric tonnes).
Air cargo volumes in the top 10 airports grew by +3% in 2020. These airports represent around 28% (30.6 million metric tonnes) of the global volumes in 2020. The gain can be attributed to the increase in demand for online consumer goods and pharmaceutical products and personal protective equipment. With a +6.7% increase, Memphis International Airport surpassed Hong Kong International Airport.
ACI World estimates that there were 58 million global aircraft movements in 2020, representing a drop of -43% from 2019. The top 10 airports represent 7% of global traffic (4.2 million movements) and experienced a drop of -34.3% compared to 2019. Atlanta Hartsfield-Jackson International Airport surpassed Chicago O’Hare International Airport, after leading in 2019 and 2018.
For airports, revenues are tightly correlated to traffic levels but, like many other capital-intensive businesses, a large proportion of airport costs remain largely fixed and do not fall at the same level as traffic throughput and revenues during the crisis. Even with reduced operations, the closure of terminals and staff layoffs, this imbalance remains.
“There is no denying the current economic realities – and the financial shortfall they create – that airports face,” Luis Felipe de Oliveira said. “Airports are economic generators, bringing socio-economic benefits and jobs to the communities they serve, and governments need to provide the necessary financial alleviation and assistance to suit local circumstances.
“Airport operators also continue to work closely with their airline partners and other stakeholders balancing the current market realities with the cost of providing the infrastructure as they navigate the crisis together.”
| CARGO (METRIC TONNES)* | |||||
| 2020 | 2019 | AIRPORT | 2020 | 2019 | Percent change |
| 1 | 2 | MEMPHIS TN, US (MEM) | 4 613 431 | 4 322 740 | 6.7 |
| 2 | 1 | HONG KONG SAR, HK (HKG) | 4 468 089 | 4 809 485 | -7.1 |
| 3 | 3 | SHANGHAI, CN (PVG) | 3 686 627 | 3 634 230 | 1.4 |
| 4 | 6 | ANCHORAGE AK, US (ANC) | 3 157 682 | 2 745 348 | 15.0 |
| 5 | 4 | LOUISVILLE KY, US (SDF) | 2 917 243 | 2 790 109 | 4.6 |
| 6 | 5 | INCHEON, KR (ICN) | 2 822 370 | 2 764 369 | 2.1 |
| 7 | 9 | CHINESE TAIPEI (TPE) | 2 342 714 | 2 182 342 | 7.4 |
| 8 | 13 | LOS ANGELES CA, US (LAX) | 2 229 476 | 2 092 003 | 6.6 |
| 9 | 8 | DOHA, QA (DOH) | 2 175 292 | 2 215 804 | -1.8 |
| 10 | 12 | MIAMI FL, US (MIA) | 2 137 699 | 2 092 472 | 2.2 |
- Cargo: loaded and unloaded freight and mail in metric tonnes
| INTL FREIGHT (METRIC TONNES)* | |||||
| 2020 | 2019 | AIRPORT | 2020 | 2019 | Percent change |
| 1 | 1 | HONG KONG SAR, HK (HKG) | 4 420 312 | 4 703 589 | -6.0 |
| 2 | 2 | SHANGHAI, CN (PVG) | 2 952 602 | 2 825 009 | 4.5 |
| 3 | 3 | INCHEON, KR (ICN) | 2 759 467 | 2 664 005 | 3.6 |
| 4 | 6 | CHINESE TAIPEI (TPE) | 2 323 412 | 2 165 216 | 7.3 |
| 5 | 10 | ANCHORAGE AK, US (ANC) | 2 221 804 | 1 942 554 | 14.4 |
| 6 | 5 | DOHA, QA (DOH) | 2 145 076 | 2 173 371 | -1.3 |
| 7 | 7 | TOKYO, JP (NRT) | 1 958 505 | 2 039 905 | -4.0 |
| 8 | 4 | DUBAI, AE (DXB) | 1 932 022 | 2 514 918 | -23.2 |
| 9 | 9 | FRANKFURT, DE (FRA) | 1 818 748 | 1 961 460 | -7.3 |
| 10 | 12 | MIAMI FL, US (MIA) | 1 730 859 | 1 706 064 | 1.5 |

