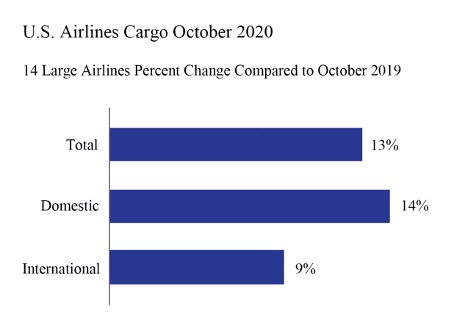
US airlines carried 13% more cargo by weight in October 2020 (preliminary) than in October 2019. The rise was fueled by gains of 14% in domestic cargo and 9% in international cargo, according to data filed with the Bureau of Transportation Statistics (BTS) by 14 of the leading US cargo airlines.
The 14 airlines carry 95% of the total cargo by weight on US airlines. Cargo data consists of freight and mail carried within the US and between the US and foreign points.
October 2020 (preliminary) air cargo numbers for 14 US carriers:
- Total:1,697 thousand tons up from October 2019 (1,506T tons)
- Domestic: 1,277T tons up from October 2019 (1,120T tons)
- International: 420T tons up from October 2019 (386T tons)
US airline traffic reports are filed monthly with BTS. Final October data will be released on Jan. 15. Complete international data by origin and destination, which is under a six-month confidentiality restriction, will be released on April 15.
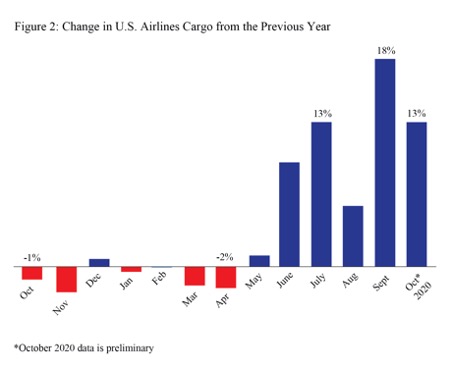
Systemwide Cargo (Domestic + International)
- October 2020 cargo: 1,697T tons
- Change from October 2019: +12.7%
- Change from September 2020: +1.3%
- Recent high: July 2020 (1,699T tons)
- Recent low: February 2020 (1,297T tons)
Table 1: Systemwide Percent Change in US Airlines Cargo Weight from the Same Month of the Previous Year 2016-2020 Cargo = Freight + Mail
| Year-to-Year Percent Change | ||||
| 2016-2017 | 2017-2018 | 2018-2019 | 2019-2020 | |
| January | 6.4 | 10.5 | 5.1 | -0.5 |
| February | 6.1 | 9.2 | -0.3 | -0.1 |
| March | 8.0 | 5.8 | -0.2 | -1.6 |
| April | 2.6 | 5.9 | 4.4 | -1.9 |
| May | 10.8 | 9.0 | 3.1 | 0.9 |
| June | 6.8 | 5.5 | -1.1 | 9.1 |
| July | 6.9 | 6.7 | 3.5 | 12.8 |
| August | 9.7 | 5.0 | 0.2 | 5.3 |
| September | 4.3 | 5.0 | -4.4 | 18.1 |
| October | 10.6 | 5.5 | -1.2 | 12.7* |
| November | 10.6 | -0.6 | -2.3 | |
| December | 5.6 | 0.3 | 0.7 | |
| Jan-Oct | 7.2 | 6.7 | 0.9 | 5.0 |
| Annual | 7.4 | 5.4 | 0.6 |
Source: Bureau of Transportation Statistics, T-100 Market
* October 2020 data is preliminary
Domestic Cargo
- October 2020 cargo: 1,277T tons
- Change from October 2019: +14.0%
- Change from September 2020: +1.9%%
- Recent high: July 2020 (1,282T tons)
- Recent low: February 2020 (977T tons)
- Domestic as percent of total cargo October 2019: 74.4%
- Domestic as percent of total cargo October 2020: 75.3%
Table 2: Domestic Percent Change in US Airlines Cargo Weight from the Same Month of the Previous Year 2016-2020
Domestic cargo has a US origin and US destination
Cargo = Freight + Mail
| Year-to-Year Percent Change | ||||
| 2016-2017 | 2017-2018 | 2018-2019 | 2019-2020 | |
| January | 4.6 | 10.4 | 6.1 | 2.8 |
| February | 4.9 | 8.7 | 0.7 | 2.2 |
| March | 7.1 | 4.0 | -0.4 | 3.1 |
| April | 1.5 | 4.9 | 7.7 | 3.1 |
| May | 10.8 | 8.9 | 4.5 | 4.2 |
| June | 5.4 | 4.5 | 0.5 | 12.7 |
| July | 5.2 | 6.7 | 6.2 | 15.8 |
| August | 9.4 | 4.8 | 0.1 | 6.6 |
| September | 3.3 | 4.3 | -2.9 | 21.1 |
| October | 11.1 | 5.7 | 1.8 | 14.0* |
| November | 11.3 | -0.1 | -1.8 | |
| December | 5.1 | 0.1 | 4.5 | |
| Jan-Oct | 6.4 | 6.2 | 2.4 | 8.0 |
| Annual | 6.7 | 5.0 | 2.2 |
Source: Bureau of Transportation Statistics, T-100 Domestic Market
* October 2020 data is preliminary
International Cargo
- October 2020 cargo: 420T tons
- Change from October 2019: +8.7%
- Change from September 2020: -0.5%
- Recent high: September 2020 (422T tons)
- Recent low: February 2020 (319T tons)
- International as percent of total cargo October 2019: 25.6%
- International as percent of total cargo October 2020: 24.7%
Table 3: International Percent Change in US Airlines Cargo Weight from the Same Month of the Previous Year 2016-2020
International cargo on a US airline is carried between a US airport and a foreign airport.
Cargo = Freight + Mail
| Year-to-Year Percent Change | ||||
| 2016-2017 | 2017-2018 | 2018-2019 | 2019-2020 | |
| January | 11.4 | 10.6 | 2.2 | -9.8 |
| February | 9.6 | 10.4 | -3.1 | -6.3 |
| March | 10.5 | 10.7 | 0.4 | -13.9 |
| April | 5.3 | 8.2 | -3.9 | -15.7 |
| May | 11.0 | 9.2 | -0.6 | -8.3 |
| June | 10.8 | 8.2 | -5.2 | -0.6 |
| July | 11.3 | 6.7 | -3.6 | 4.5 |
| August | 10.6 | 5.6 | 0.4 | 1.7 |
| September | 7.2 | 7.0 | -8.3 | 10.2 |
| October | 9.4 | 5.0 | -8.7 | 8.7* |
| November | 8.8 | -1.8 | -3.5 | |
| December | 7.2 | 0.9 | -10.6 | |
| Jan-Oct | 9.7 | 8.0 | -3.1 | -3.6 |
| Annual | 9.4 | 6.5 | -3.8 |
Source: Bureau of Transportation Statistics, T-100 International Market
* October 2020 data is preliminary

